Home Monitoring (home made) – Results
02/03/2014
And finally the results of all work!
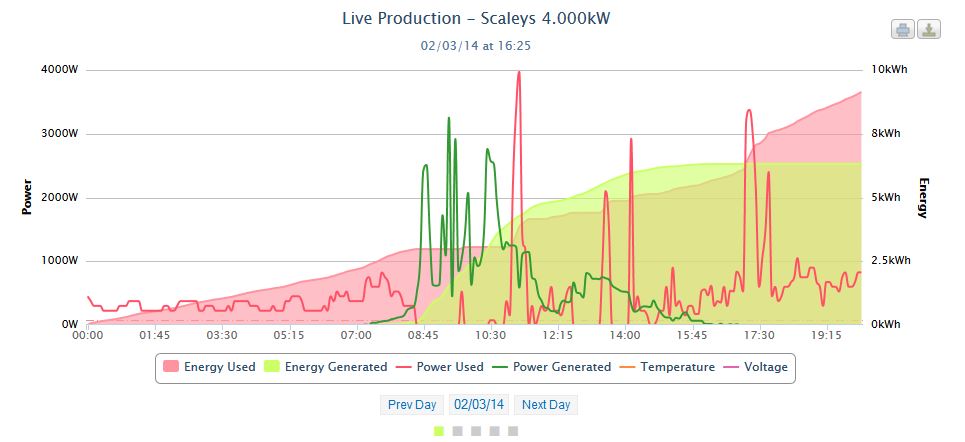
There isn’t any change on the first graph which shows generation and import (yes, it should be consumption, but I have yet to work out the right values for the addstatus service).
The next graph is the result of all the hard work. I’ve set it to use v10 and v11 because of the colour contrast. As you can see in the graph, the solar hot water was powered a handful of times during the morning, boosting the temperature of the hot water a little. The results will be far more dramatic in the summer.

And that’s pretty much it, until next time! Maybe a weather station next time 😉


Please enable the Disqus feature in order to add comments